airbnb
 Apple
 Alibaba
 Amazon
 Toyota
Performance
See which channels, campaigns and content are changing your results.
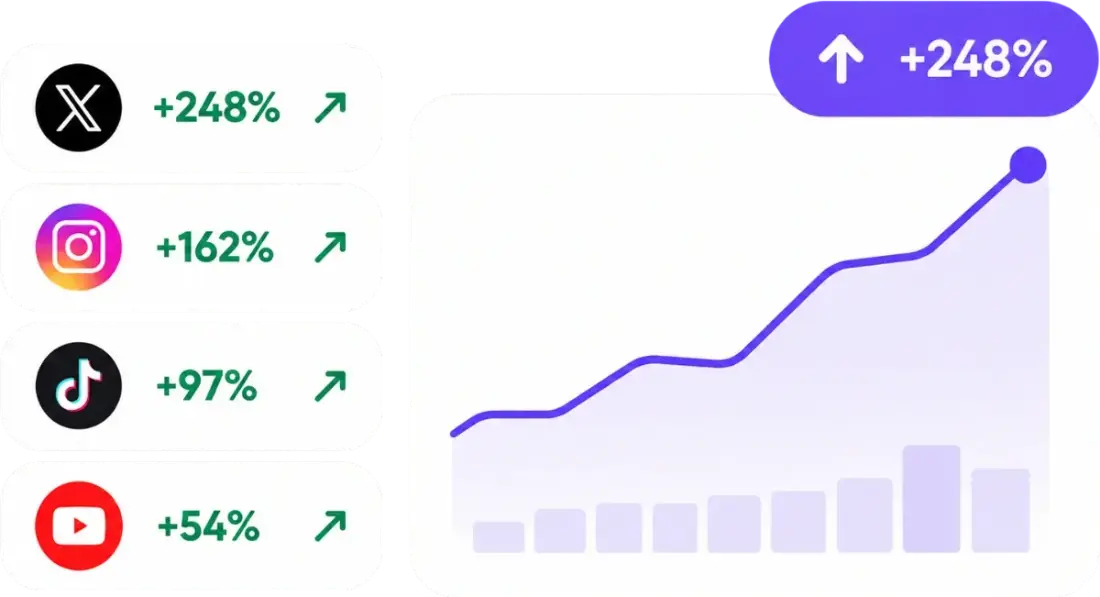
Measure reach, engagement, growth, share of voice and sentiment across social platforms — then trace the numbers back to the conversations behind them.
 4.8★★★★★rated on G2
Reach, engagement, sentiment and share of voice are useful signals — but they rarely explain themselves. Lolly connects social performance to the conversations, themes and events behind the numbers so teams can move from reporting to understanding.Lolly links your social metrics to the conversations and events behind them, so you know why they moved.
See which channels, campaigns and content are changing your results.
Connect movement in the numbers to the conversation around it.
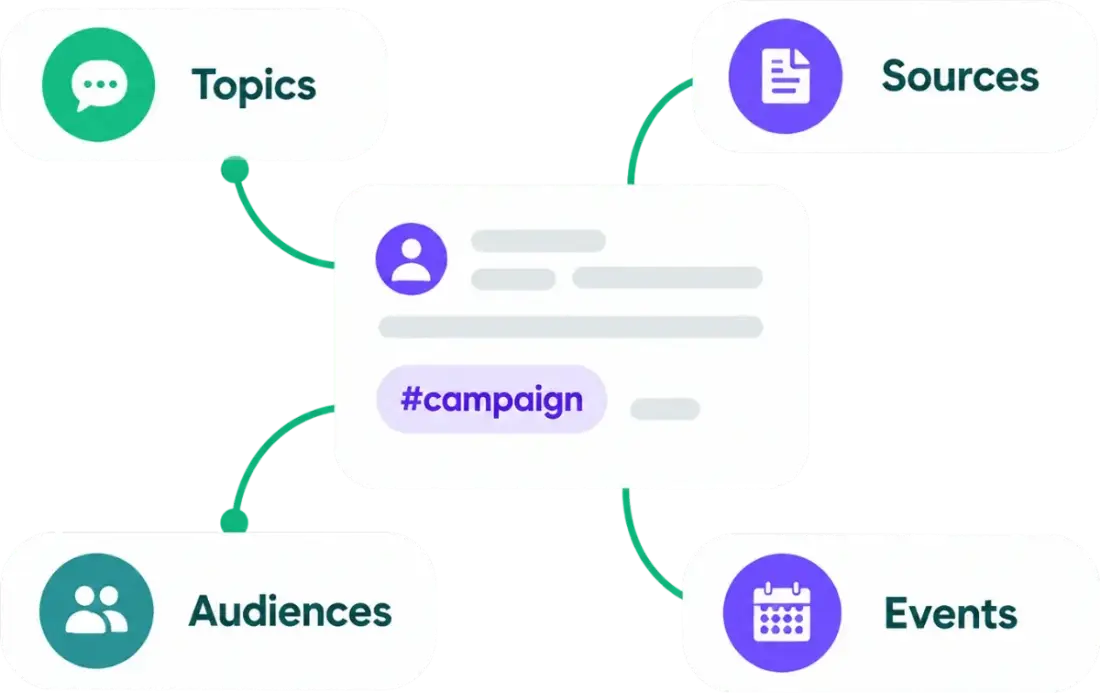
Put your performance in the context of competitors and category activity.
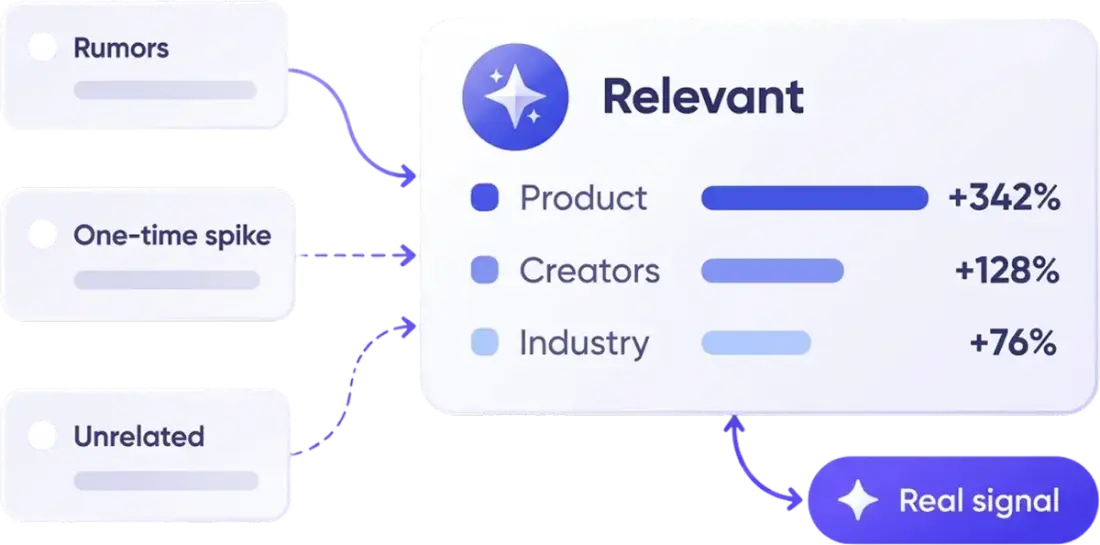
Track the metrics teams use to understand visibility, engagement and audience response.
Compare your brand’s presence with competitors and category conversations to add context to performance.
Examine how campaign moments, messages and creative themes show up in audience response.
Break performance down by channel, market, topic or campaign so teams can see where results differ.
Move from a change in a metric to the underlying mentions, themes and conversations that help explain it.
Reach is up 24% and engagement rate is down 3 points, so the month bought distribution, not attention.
Instagram added the reach. TikTok held 31% share of voice on a third of the posts — that is where the attention actually is.
Both figures trace back to the 1,284 posts behind them, and the export is ready.
Ask Ana to turn social media data into clear insights on reach, engagement, performance, and growth.
Trace the finding back to the conversations that explain what changed.
Give leadership a view of performance with the conversation and competitive context behind the numbers.
Connect campaign metrics with the conversations, sentiment and audience response surrounding each launch.
Compare performance and conversation against competitors to understand where attention is moving.
Measure how much of the relevant conversation belongs to your brand and how that changes over time.
Compare markets, channels and audience segments to identify where performance differs and why.
Trace a change in a metric back to the conversations, content and events that influenced it.
It is the measurement and interpretation of social media performance using metrics such as engagement, reach, audience response and share of voice.
Common measures include reach, engagement, growth, sentiment, share of voice and campaign-specific performance indicators.
Source-level context helps explain why a metric changed and gives teams evidence they can investigate rather than relying only on an aggregate number.
Lolly’s social intelligence workflow can be used to compare brand and competitor conversations, including share of voice and related performance signals.
Marketing, social, communications, insights and executive reporting teams commonly use social analytics to measure performance and explain change.
See what changed, understand what drove it and explore the conversations behind your social performance.